Flavius and Septimus

Last night I stumbled upon this article about change and when one crosses over into the Twilight Zone, from the Healthcare Information and Management Systems Society (HIMSS),  head-quartered in Chicago, and with additional offices in the United States, Europe, and Asia, is a cause-based, not-for-profit organization global enterprise producing health information technology (IT) thought leadership, education, events, market research and media services around the world, focused on better health through IT.

I think the story strikes an analogy that is relevant to everyday challenges in life and to any profession  as we struggle  to transition from the present which is rooted in the past (as we cling on the present so stubbornly because we fear change) to the future with a vision.

The story is of a man at work, Gaius Flavius Lautumiae who is the emperor’s royal stonecutter, stone-cutting has been the only work he knows and ever known in his whole life. The scene – the emperor’s royal quarry where Flavius is working on a stone monument for the recently deceased emperor.  The dialogue with his close friend, Septimus goes like this ….…

SEPTIMUS: But Flavius, the whole world, all of civilization has made the change.  Even the Celts!  Think about it: even the primitive Celts have gone over.
FLAVIUS: I tell you, Septimus, it matters not which barbarian hordes have changed their ways!  We Romans have been using these numbers since the time of Julius Caesar, even before the emperors came to be.  If it was good for them, it is good for us, and it will be good for our children.
SEPTIMUS: Flavius, come to your senses.  You know that the royal son will become the emperor after that stone you are cutting has been set in place.  We have all been warned that he comes to the palace with countless scrolls filled with writings telling us about new ways to do many things.  The new ways will become our ways.  It will be decreed.
FLAVIUS: Septimus, you should know that it was the old ways that got us here, and it will be the old ways that take us to tomorrow.
SEPTIMUS: But Flavius, have you even looked at the new numbers?  They are amazing!  One simple stroke and a value can be recorded.
FLAVIUS: Bah!  You call all of those circles and curves simple?  They’re a nightmare!
SEPTIMUS: As a stonecutter, you may see it that way. But everyone who has made the change attests that the new numbers are a wonder.  A wonder!  They open many new vistas for us. This new system will allow our civilization to progress. Without it, I fear that Rome may no longer be… Rome.
FLAVIUS: I cannot accept the change.  I see no reason to change.  I care not for new vistas; I just desire to cut my stone with simple, straight lines.

Flavius is an example of an individual who continues to live in the yesterday, its memories are all that is what he wants, yesterday is what he will get and tomorrow will never come for him.

Is CHANGE good or bad?

Georg  C. Lichtenberg  (1 July 1742 – 24 February 1799), who was a German scientist, satirist and Anglophile (a person who greatly admires or favours England and things English) once said “I cannot say whether things will get better if we change; what I can say is that they must change if they are to get better.”, and I trust him so just to take him at his word.

References:

  1. No Time Like the Past, News, Healthcare Information and Management Systems Society (HIMSS), viewed 29 May 2013, <http://www.himss.org/News/NewsDetail.aspx?ItemNumber=18547>

24 beds to go at Morriston Hospital, Wales – a casemix exercise

I have not blogged about casemix yet, and with this post I intend to kick-start my attempt to share my comments, opinions, views on how health management everywhere have changed the way of doing things in hospitals by applying casemix ideas as an information tool involving the use of scientific methods to build the classifications of patient care episodes by classifying patients into classes or groups which are both clinically coherent and resource homogenous.

I learned about a news article from the South Wales Evening Post about how health management in Wales intends to change the case mix in their hospitals, because they claimed that the existing service is splintered between various sites and therefore inefficient.

To better understand the situation there, I ran an Internet check of healthcare services in Wales, so I could better comprehend what the article was reporting, and to focus on how casemix ideas were applied to bring about the changes at Morriston Hospital, Princess of Wales Hospital, Neath Port Talbot Hospital, and Singleton Hospital, namely the hospitals referred to in the article.

In Wales, seven Local Health Boards (LHBs) are responsible for planning and securing delivery of primary, community, secondary care services, and also the specialist  services for their areas. Abertawe Bro Morgannwg (ABM) University Health Board is one of the largest Health Boards in Wales. It is responsible for three localities – Swansea, Neath Port Talbot and Bridgend areas (see map below of all Hospitals in these ABM localities).

Map credit : Abertawe Bro Morgannwg (ABM) University Health Board

It covers both primary (GPs, pharmacies, dentists and optometrists etc) and secondary (hospitals) care.

Photo credit : http://www.thisissouthwales.co.uk/

Morriston Hospital (left) covers the same geographical area as the City and County of Swansea and has around 750 beds. Morriston Hospital is the site of the major Accident and Emergency Department for Swansea and, with its accessibility to the South West Wales population, is recognised as the Major Trauma Centre for South West Wales.


Photo credit : http://www.wales.nhs.uk/

Princess of Wales Hospital (right) is a district general hospital located on the outskirts of Bridgend town in South Wales. This hospital provides a comprehensive range of acute surgery and medicine for patients of all ages, including inpatient, outpatient and day services, including Accident and Emergency Services.


Photo credit : http://www.thisissouthwales.co.uk/

Neath Port Talbot Hospital (left) has 270 beds and provides a range of inpatient, outpatient and day case services for the people of Neath and Port Talbot.


Photo credit : http://www.thisissouthwales.co.uk/

Lastly, Singleton Hospital (right) is a modern District General Hospital with 550 beds situated on Swansea Bay, adjacent to the campus of Swansea University.


Health authorities in the ABM localities plan to lose hospital beds as a result of a shake-up of health services due to take place during September or October 2012, although the planning for them had already started. As a result, Morriston will lose 23 beds and Singleton, 1 bed.

Health authorities think advances in patient care mean they no longer need as many beds as were necessary in the past.

The change of the case mix in the hospitals served by ABM will change as follows :

  1. Morriston Hospital will to continue to deal with emergency cases, along with Princess of Wales in the Bridgend  area
  2. Morriston Hospital will take care of all complicated elective (pre-planned) orthopaedic operations from across the ABM area
  3. At the moment trauma and orthopaedics are also carried out at Neath Port Talbot Hospital;
  4. Trauma and orthopaedics will no longer be carried out at Neath Port Talbot Hospital but will become a centre of excellence for short-stay orthopaedic surgery

Patients who have had complicated surgery in the two acute hospitals (Morriston and Princess of Wales hospitals) will, as soon as they are well enough, be moved for rehabilitation in Singleton, Neath Port Talbot and Princess of Wales hospitals, depending on where they live; this will free up beds at Morriston for trauma and complex surgery, and it will also mean patients will recover closer to their homes and families.

The drive to rehabilitate results in quick turnover, and hopes to enhance the recovery process after surgery which in turn will lead to better outcomes and reduced readmission rates. For example, if patients have to travel to Morriston or Bridgend for major joint replacement the time they will be there will be much shorter. This according to Phillip and Julie 2011, patients with greatest needs are treated preferentially (vertical access equity as according to Phillip and Julie 2011).

ABM said the aim was to establish a level of care across the board area so that, no matter where people were from, patient health needs are treated alike (horizontal access equity as according to Phillip and Julie 2011).

Health chiefs in the ABM Area have insisted as long as the patient flow was right, the changes in trauma and orthopaedics do not represent any reduction of the service by withdrawing the service and by losing some beds. They also insisted cost-cutting was not the objective of this patient care exercise, but to actually lead to improvement in patient outcomes and pathways for specific patients, particularly the frail and elderly, who have fractured neck of femurs. ABM says that, in the past, elderly patients with serious fractures tended to spend a long time in hospital and their condition deteriorated, sometimes fatally.

ABM has also flagged up the need to strengthen links with social services, particularly to ensure elderly patients who need support at home are not stuck in hospital longer than necessary.

This case mix exercise in Wales seemed like a good idea given the reduction in beds. ABM remained confident there would be a sufficient number of beds to run the service and they could manage as they had built-in some capacity to expand if they do have a busy time.

ABM believes the change in casemix among its hospitals is sensible from all angles – finance, and patient care and also resolving ABM’s significant issues with junior doctor cover. I think the change in casemix has allowed for meaningful comparison of activity between hospitals managed by ABM in Wales.

Internet sources:
Abertawe Bro Morgannwg (ABM) University Health Board , viewed 30 July 2012, <http://www.wales.nhs.uk/sitesplus/863/home>

Phillip B & Julie B 2011, Casemix for Beginners, viewed 15 July 2012, <http://casemixconference2011.com.au/LiteratureRetrieve.aspx?ID=103882>

Abridged by R. Vijayan from an original article in the South Wales Evening Post, July 19, 2012

ICD-10 ‘drives him crazy’

This is what Kaiser Permanente’s CEO  George Halvorson thinks and feels about ICD-10.
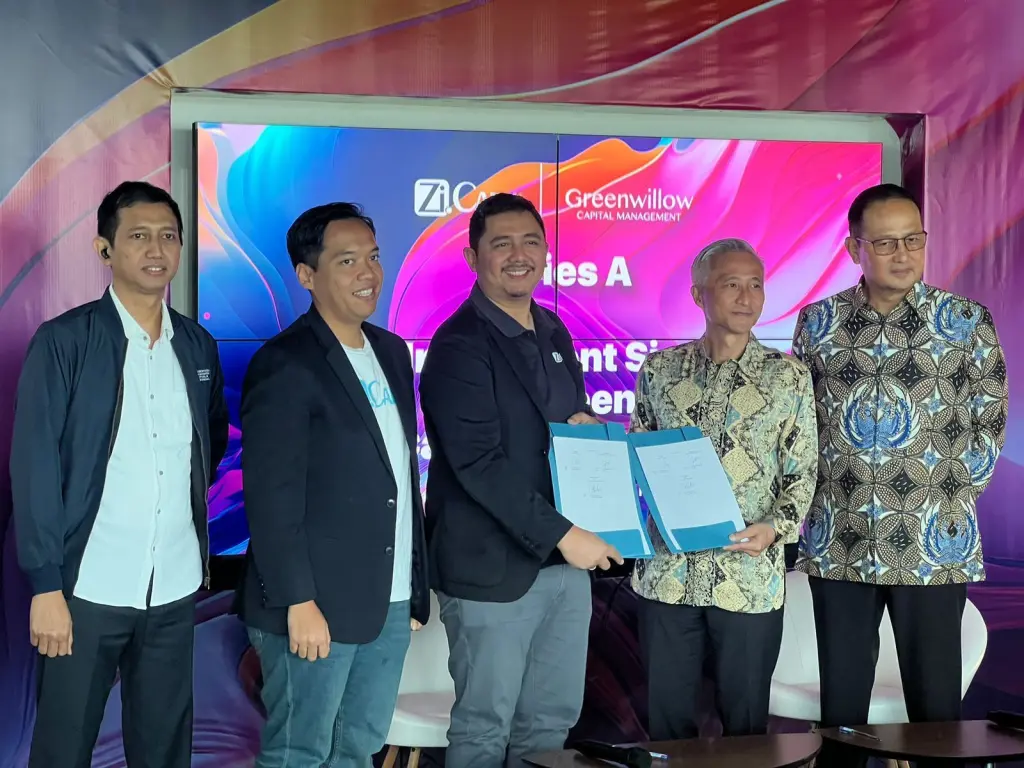
“I hate ICD-10. It drives me crazy, it adds so little value, and I can’t find any therapeutic upside”

“The upcoming deployment of ICD-10 is anathema to my organization”

“The use of ICD-10 is a response to running out of current diagnosis-related group (DRG) codes rather the a logical expansion based on clinical data”

“They’re putting the current codes into certain buckets to expand them, and they’ve run out of room”

“It is more suited to work with a paper-based medical record system”

“I am looking toward the ICD-11 iteration, in the hopes it might be better integrated with electronic health records”

“Kaiser’s rollout of an EHR system is saving about $3 billion in annual costs by making it more efficient to treat chronic conditions and combat sepsis, which kills tens of thousands of hospital patients a year”

However, communications officer Ravi Poorsina at Kaiser said Kaiser will still deploy ICD-10 since according to him,  “I think we’re required to”.

Abridged from Kaiser CEO on why ICD-10 ‘drives him crazy’ by Ron Shinkman, June 26 2012, FierceHealthFinance

Note: The above remarks by Halvorson were made during a question and answer session after delivering a keynote speech at the Healthcare Financial Management Association’s Annual National Institute on Monday, June 25 2012, at the Mandalay Bay Resort and Convention Center in Las Vegas, USA.

Race to the ICD-10 Finish Line

In the US, the race is on to comply with ICD-10 by 1 October 2013!

Take a look at this info-graphic from teksystems.com about the race to this finish line. It tells the story about the healthcare system in the US and their partnership with healthcare vendors to implement ICD-10 there.

We in Malaysia, had no such fiery race but a finish line to switch over from ICD-9 to ICD-10 during the transition period from as early as 1998 to our finish line on 31 December 1998, and we started using ICD-10 by 1 January 1999 in our morbidity and mortality reporting systems, some 14 YEARS earlier than in the US!

I think as HIM/MR professionals, we are the ones who need to spearhead the next big thing in ICD, that is ICD-11 when medical records systems in Malaysia would probably be IT driven. Our hospital IT departments are usually with a young and usually inexperienced workforce(my experiences and opinion). I also think it will be wise to take the lead and not make them to struggle with the then implementation of ICD-11 or even ICD-10 if your hospital plans to go the EMR way in the foreseeable years, because they would be lacking the  experience, skills and bandwidth to handle ICD systems.

8 Ways You Can Visualise Proportions

Reviewing student assignments, I come to live with the fact of life that there is much to be desired in terms of creativity, critical thinking, depth, style, understanding of concepts, presentation, grammar and written language.

Looking back at the assignment which included the use and interpretation of graphs to visualise proportions, I suddenly thought I would make a post on graphs and how they can aid visualisation, and share with you the reader of this website-blog, and this post in particular.

In the course of your work as a HIM/MR professional, you must have prepared graphs using the computer. Chances are you prepared pie charts, the stacked bar(either vertical or horizontal bars), and just plain bar graphs and line graphs.

Since I had started posting on JCI Standards, I remember well when I used radar charts to display compliance ratings in medical records review findings report while working with my JCI experiences. I shall talk more on this in my coming post on the JCI Standard MCI.19.4.

A radar chart looks like this one:

Now, let us look at 8 ways to represent data we churn out each day, visually to represent proportions.

Pie charts and stacked bars are two ways used to represent proportions, you have used it!

You used a pie chart(WAY 1), which is a  circle which represents the whole, and the size of each wedge represents a percentage of that whole, all wedges add up to 100 percent. For example, you may have presented the 10 leading causes of mortality in a pie chart for a particular year, and used the stacked bar chart (WAY 2) to represent for example proportions of 10 leading causes of morbidity for a number of years in a vertical stacked bar chart.

Likewise these other 6 graph types can also be used to represent proportions.

The donut (WAY 3) is the same idea as the pie, but with a hole cut out in the middle. Here is one example:

The stacked area chart(WAY 4) is used to show changes over time for several variables. You can use it for percentages, where the vertical always adds up to 100 percent, or you can use raw counts if you’re more interested in the peaks and valleys. Here is an example:


The treemap(WAY 5)  uses the areas of rectangles to show relative proportions. It works especially well if your data has a hierarchical structure with parent nodes, children, etc. One example is :


A Voronoi diagram(WAY 6) uses polygons to represent area as well to visualize magnitude, except instead of rectangles or wedges. The Voronoi diagram is more flexible over some of the problems when restricted to rectangles to represent areas. One example is:


If you want to focus on a single data point and need to show every individual count within a data point, then consider using the Everything(WAY 7) .  It takes up a lot of space, but sometimes puts things in better perspective, like in this way:


The Nightingale rose graph – or the polar area diagram(WAY 8), coined after its creator, Florence Nightingale, is like a combination of the stacked bar and pie chart. The length of radius is used to indicate one thing, usually a count, and polar area represents a portion of the whole. I like to tell you more on the Nightingale rose graph in some future post, and looks like this:

I hope I have not drawn you too deep technically into this blog post, but I wish you can respond and talk about these things in your life and work, by leaving your comments.